Smart ETL with Data Prep: Time Series Forecast Transform Got Better in Spring ‘22!
In Spring ‘22, Time Series Forecasting in Data Prep Recipes just got much more powerful with the introduction of Grouped Forecasts~~!!
What is Time Series Forecasting in Data Prep?
Data Prep Recipes run on our next-generation data platform, which includes machine-learning powered Smart Transformations out of the box: Detect Sentiment, Predict Missing Value, Clustering, and Time Series Forecasting. Time Series Forecast uses the Holt-Winters algorithm to forecast measures over a date range in our data engine.
Time Series Forecasting in Spring ‘22
To start forecasting data, you simply need to:
- Add a Transform node to your data in your Data Prep Recipe
- Click on the “Time Series” icon in the toolbar
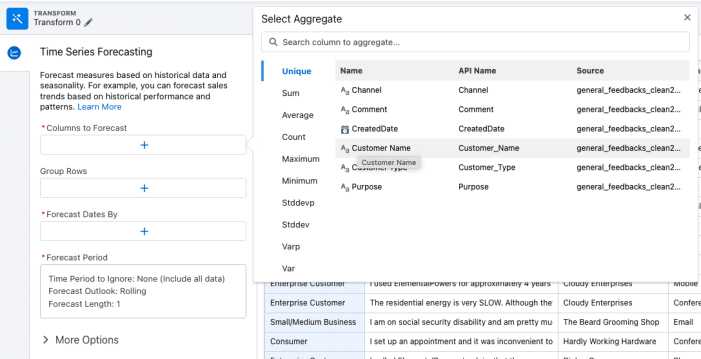
- Select the measures to forecast, then choose the forecast grouping (if applicable), the forecast date field and the forecast length.
- et voi la!
Let’s break that down:
“Columns to Forecast”
This is the data you want to forecast. Observe that it’s an aggregation – so it can be Sum of Amount, Count of Rows, Average of CSAT, etc.
You can forecast up to 500 measures in one Time Series Forecast transform.
“Group Rows”
This is the forecast grouping (or forecast levels or forecast hierarchies) that you may define in order to forecast in that grouping. It can be a Region, a Product Family, a Product Name, etc.

You can choose up to 100 columns for forecast grouping. Obviously, the more grouping columns you have, the more fine-grained forecasting the algorithm will perform, and therefore the more forecasts will be performed at each grain, which means the transform will take longer. You will need to decide the granularity that meets your business needs and balances the performance characteristics.
“Forecast Date“
Perhaps unsurprisingly, since you’re trying to perform a TIME SERIES Forecast, your data needs to have a date.
Pick a date column…

… then pick a supported date grouping format…

And the Forecast Column data will be aggregated by the date and the forecast grouping columns.
Note: Fiscal date groupings aren’t supported at this time.
“Forecast Period”
At this time, you can decide if you want to include all the data or ignore the last time period (in case the last time period data is incomplete).
The supported forecast outlook is Rolling only at this time; we may introduce a fixed forecast (eg Current and Next Fiscal Year, Current and Next 3 Fiscal Quarters) in the future if enough customers request it.
The forecast length is how far you want to forecast; so if your date is grouped at Year-Month, and you’re forecasting rolling 12, that’s rolling 12-month forecast from the date of the recipe execution, NOT the last date of the data. So if your data ends in the month of September 2021, and you are running Time Series forecasting in December 2021 for rolling 12 months, transform will forecast data from October 2021 (first month of not having any data) to Dec 2022 (12 months after the recipe running month).

“More Options”
Seasonality: You can define the length of the seasonality in your data (eg 12 months, 4 quarters, 7 days in a week, etc) to help improve forecast accuracy; the default is None. If you choose Auto, the algorithm will attempt to decide the seasonality based on the date grouping (eg Year-Month = Seasonality of 12)
Model: You can choose Additive or Multiplicative based on your seasonal data variations… additive means the size of the variation is relatively the same, whereas multiplicative means the multiples of the size of the variations across seasons are relatively the same.
Generate Confidence Interval: You can generate upper and lower confidence intervals for the forecasting; the options are limited to 80% and 95%.

That’s it! You are now ready to forecast data in Data Prep Recipes!
A Note about the previous Time Series
Prior to Spring ‘22, a user needed to aggregate the data manually before trying to forecast it via Time Series Forecasting. There also was no support for forecast grouping. In short, its usefulness was limited if you needed forecast grouping, such as forecasting by region, or by product family, or even by account; the enhanced Time Series transform in Spring ’22 enables you to do all of that.
If you have the old one in your recipe, it will continue to work, but once you delete it, you can only add the latest Time Series transform, which is much more powerful anyways. As the product owner bringing this capability to market, I recommend you use the new one and replace your old Time Series as soon as possible. For backward compatibility, all you need to do is create a new Time Series transform without specifying any forecast groupings.
Get Cracking!
I’d love to hear from you about what you’re forecasting in Data Prep Recipes, the business challenge you’re trying to solve, and what we should do next to make it work for you! Give the enhanced Time Series forecast a shot and share your feedback with me directly on the Trailblazer Community, on Idea Exchange, or join us on Slack at DataTribe! I want to put this power at your fingertips but I need your help to make it work for you – please share your use cases and feedback with me so we can make it better!