Pipeline Velocity – a less common sales metric
Do you provide pipeline velocity within your analytics? That was a question recently presented to us by one of my customers. In the 10+ years I’ve been at Salesforce that was the first time I had heard that question. And to be completely transparent I wasn’t sure what pipeline velocity is and how it’s calculated. So without a Yes or a No I told them that I’d look into it and get back to them.
Sales organizations leverage a plethora of metrics to gauge how well they are performing. Win Rate, ACV Growth, Retention, Sales Cycle Duration, and Activities are examples of what we typically encounter. But in many ways, these metrics exist in isolation from one another.
Is there a metric, or better yet a formula, that leverages several of these metrics to measure how well a sales organization is performing?
Yes, and it’s Pipeline Velocity. Let’s now look at what that is.
What Is Pipeline Velocity?
While the calculation of pipeline velocity is a debated topic Pipeline Velocity is a simple, yet powerful way to gauge the health of your sales business. Pipeline Velocity measures the speed at which you are generating sales in your business. An interesting factoid about this metric is that the changes over time are more important than a single time period. Pipeline velocity data is only relevant when compared to the velocity over time. In other words, Q1 to Q2 to Q3 vs just Q3.
Given this new knowledge do we have any assets in our standard reports and dashboards or CRM Analytics that address this? Turns out we do not. While we do have Stage Duration Analysis dashboards (see below) and opportunity snapshots they do not fulfill the requirements of pipeline velocity.

So, if we don’t have any pipeline velocity reports or dashboards then what do we have? As it turns out we have most if not all of the necessary data. Some of that data exists as part of an opportunity record, some data needs a simple calculation and some data needs a custom field to be established. But, at the end of the day all of the data, or the ability to create that data, that is needed to calculate pipeline velocity exists within Salesforce.
Calculating Pipeline Velocity
To calculate pipeline velocity you need to calculate several metrics.
Win Rate
Win Rate is calculated by dividing the number (count) of Deals Won by the number of Total Deals Closed. Total Deals Closed is defined by the count of Closed Won Deals plus the count of Closed Lost Deals.
Win Rate = Closed Won Deals / (Closed Won Deals + Closed Lost Deals).
ACV
ACV is determined by the Sum of the Opportunity Amount associated with the Closed Won Deals.
Sales Cycle Duration
Sales Cycle Duration, measured in Days, is simply determined by subtracting the Opportunity Created Date from the Opportunity Close Date.
Sales Cycle Duration = Opportunity Close Date – Opportunity Created Date
In my model, I used a custom field at the opportunity object level to capture this value. An alternative approach is to create a formula within a CRMA recipe.

Either approach is acceptable but my preference is to capture the value at the object level. That way I can push to CRMA or even use for List Views or standard reports and dashboards.
Qualified Deals
Qualified Deals represent the number of opportunities that moved into a qualified sales stage. It is not the total number of qualified deals that are currently open.
Unless the customer only creates qualified deals this requires a custom Qualification Date field on an opportunity to capture the date when an opportunity moved into the 1st qualified sales stage. This date capture can be set up in Salesforce and run based on the rules specific to each customer.

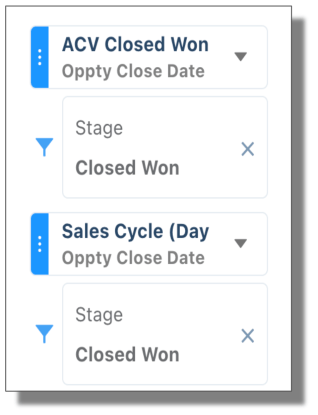

As you begin creating the measures necessary for this formula it is important to note that Win Rate, ACV, and Sales Cycle Duration are grouped by the Opportunity Close Date with filters on the Sales Stage of either Closed Won or Closed Lost.
Here, I created the necessary measures using formulas in a lense. Alternatively, you could establish these measures in a recipe.
Qualified Deals are grouped by their Qualification Date and typically do not have any additional filters applied to them.

Once you have your calculated values, and apply the standard pipeline velocity formula, you can easily calculate pipeline velocity.
The Lookback period represents the time period you are looking to analyze. Typically, it’s either a Quarterly (91 days) or Annual (365 days) period.

Visualizing Your Results
With all of the necessary measures now calculated we can begin to assemble this colorful mess into a suitable dashboard.


Now, with the goal of calculating pipeline velocity, I’ve purposely kept this dashboard low-calorie. But even in its simple state, you can start to see how the individual metrics impact pipeline velocity. For example, looking at 2023-Q1, the pipeline velocity is 2x the size of its neighboring quarters. This is even though the ACV for Q1 is less than both Q4 and Q2. This is due to Q1 having a very low Sales Cycle Duration and the number of qualified deals was highest in Q1.
As I look to expand upon the usability of the dashboard you could incorporate filtering/grouping by Industry, Seller, Lead Source, Market Segment, and Time Period. I can include averages for the key measures, trending analysis across the measures, and perhaps even incorporate an Input widget for What-If type scenarios for future time periods.
Impacting Pipeline Velocity
As you look to understand how an organization can improve upon its pipeline velocity the answer lies in the associated measures.
Increasing The Number of Qualified Opportunities
Not only increase the number of opportunities but also increase the number of deals being qualified. Generating a large number of new opportunities that will never be qualified or just dumped to Dead No Decision is not a viable strategy.
Increasing The Win Rates
The next number is the win rate. This requires a deep dive into your existing sales process. Since this represents the entire sales process from the initial qualified lead to final closed sale, a lot of other conversion rates along the way should be looked at. It’s possible that you might find one issue with one stage in the sales process, as opposed to a lot of issues all along the way.
Increasing Average Revenue Per Opportunity
Yes, you can raise your prices, but you can’t raise them every month. What you can do is make sure you’re digging deep enough with your clients (discovery, discovery, discovery) to identify all of their challenges and give them comprehensive recommendations.
Shortening The Sales Cycle
In theory, you can work towards shortening your sales cycle. However, due to the sheer amount of solutions available to prospects and the general confusion most prospects are facing when making purchase decisions, not to mention the strength of the economy and the impact of rising inflation, you’re more likely to see an increase in the sales cycles.
My Closing Thoughts
Researching what Pipeline Velocity is and how can you can use Salesforce to calculate it was an excellent exercise to dive into and learn something new. Considering that the need for pipeline velocity hasn’t come up in a lot of my customer conversations doesn’t necessarily dilute the importance of this metric to a selling organization. Not only is pipeline velocity useful as a measure of sales success but also a measure of the success of the Sales Cloud implementation. As my customer rolls out their MVP and begins to measure success I can certainly see them looking at this.
What else did I learn? To start, a little bit of history about the genesis of the pipeline velocity formula. While I can’t fully support their claim Altify lays claim to being the first to define pipeline velocity in 1988. The debated topic mentioned at the beginning of this article is related to what constitutes the number of qualified deals. Some define it as the total number of Open Qualified Deals while others define it as the number of deals that have moved to a qualified stage. I’ve aligned with the latter for this article though the former would do away with the need for capturing a Qualification Date on the opportunity.
Thank you for reading my blog. I hope that you find this information helpful and insightful. If you have any questions please do not hesitate to reach out to me.
Resources
A Deep Dive on Pipeline Velocity
How to Calculate and Use Pipeline Velocity
What is Pipeline Velocity and How to Optimize It?
Equations and Formulas
Optimize Sales Effectiveness with the Sales Velocity Equation
Thank you for this post. I found it very helpful. Question – the Pipeline Velocity formula appears to be the same as the Sales Velocity formula. Do you see them as the same or different? If different, can you please share why? Thank you!