Hack for Date Groupings in Static Steps
In April I did a blog on how to use date fields in static steps showing how to create filters and groupings [read the blog post]. Though the blog is still relevant I had several people comment that it didn’t work. I did a little debugging and it turns out that Einstein Analytics is a little particular in terms of how the JSON instructions should be written. And in one of the releases after I wrote the original blog they have added a “feature” where the one JSON line you add while creating your step is no longer converting it into the correct format.
Anyway, let’s see if we can’t shave down the many lost hours on this.
Why isn’t it working?
As I mentioned above the static step builder is adding a little extra when you add your string. So in my blog I wrote to add the following:
[“CloseDate_Year”,”CloseDate_Month”]
What you will find is you get an error like this:

Now, why is that? If we look behind the scenes in the dashboard JSON you will see this:

As you may notice in line 319, we are getting a few more characters than what we actually put in creating the static step. Instead, we need something like line 323 to line 327.
How do we fix it?
Well, we can either try to remove the unwanted characters or copy from another lens and paste them into the dashboard JSON if you are worried about removing the right characters. Be aware that I have experienced a few cases where it still didn’t work even though I removed the right characters, but the copy/paste fix did the trick instead.
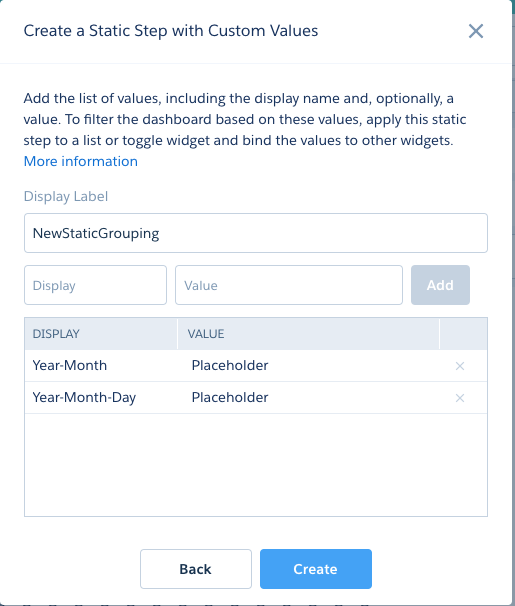
Start by creating your static step as described in the original blog. Click “Create Step” then choose “Create a Static Step with Custom Values”.

Give your step a name and add your values. Keep your display as you want the user to see but just put “Placeholder” as your value. Finally, click “Create”.
Now you have your new step we need to modify it. First, open up a lens from the dataset you are using in your dashboard and do a grouping by your date field (Year-Month). In my case, it will be Close Date (Year-Month).

Now go to your lens JSON (command+e or control+e), find your grouping and copy it. Remember I am only interested in line 16 to 19.

With that copied go back to your dashboard and switch to JSON mode (command+e or control+e). Find your static step. I normally use the command+f or control+f function, put in my step name and search for it. In this case, you can also search for the word “Placeholder”. It’s just the quickest way to find anything in the JSON.
When you have the right step in front of you we now want to replace “Placeholder” including the quote signs with the grouping we just copied from the lens. Be aware you choose the right Placeholder to replace. We want the Year-Month as that matches our grouping.

Now follow the steps above for the Year-Month-Day grouping.

When done make sure that your selection binding for the grouping is updated to use this step. If you are unsure about this go back to the original blog and follow the steps.

Now go back to your dashboard designer. We need to make sure the toggle is using your new static step. So remove the step from your existing date toggle (if you have one of course else create a new one). Drag the new static step into your toggle and preview your dashboard. Note that you may want to pick an initial filter by clicking the three dots in the top right corner, else your chart won’t have a grouping to begin with.
That’s the fix – I hope you get it working now.
Hi Rikke..Thank you for great post. i tried with your new post for Year- Month grouping but
i am getting error with static step -This widget can’t be displayed because there is a problem with its source step:
a.replace is not a function
Please help what wrong i am doing.
“steps”: {
“staticstep2_1”: {
“type”: “staticflex”,
“numbers”: [],
“strings”: [],
“groups”: [],
“broadcastFacet”: true,
“selectMode”: “singlerequired”,
“label”: “staticstep2”,
“values”: [
{
“display”: “Created Date(Year- Month)”,
“value”: [
“CreatedDate_Year”,
“CreatedDate_Month”
]
}
]
},
and grouping
“groups”: [
“{{column(staticstep2_1.selection,[\”value\”]).asObject()}}”
],
Does your receiving step have columnmaps in it? That will mess it up. I’ll see if I can’t type up a blog on it.
Hi,
“chart_1”: {
“parameters”: {
“autoFitMode”: “keepLabels”,
“showValues”: true,
“bins”: {
“breakpoints”: {
“high”: 100,
“low”: 0
},
“bands”: {
“high”: {
“color”: “#008000”,
“label”: “”
},
“low”: {
“color”: “#B22222”,
“label”: “”
},
“medium”: {
“color”: “#ffa500”,
“label”: “”
}
}
},
“legend”: {
“showHeader”: true,
“show”: true,
“customSize”: “auto”,
“position”: “right-top”,
“inside”: false
},
“columns”: [],
“axisMode”: “multi”,………………………….
its “columns”: [ ], in Widget of this step chart property.
Grouping is working for every other Display-value for this static step except for this “Year- Month ” pair.
Thank you for helping
It should be in the widget as well as the step.
Hi rikke.. i added in step as well but still not working for “Year -Month”. PFB code
{
“label”: “New dashboard 2”,
“mobileDisabled”: false,
“state”: {
“dataSourceLinks”: [],
“filters”: [],
“gridLayouts”: [
{
“name”: “Default”,
“numColumns”: 12,
“pages”: [
{
“label”: “Untitled”,
“name”: “36201d92-315e-4fa0-aa67-ce72fa23f6c1”,
“widgets”: [
{
“colspan”: 10,
“column”: 2,
“name”: “container_1”,
“row”: 0,
“rowspan”: 8,
“widgetStyle”: {
“borderEdges”: []
}
},
{
“colspan”: 4,
“column”: 2,
“name”: “chart_1”,
“row”: 3,
“rowspan”: 5,
“widgetStyle”: {
“borderEdges”: []
}
},
{
“colspan”: 5,
“column”: 7,
“name”: “listselector_1”,
“row”: 3,
“rowspan”: 5,
“widgetStyle”: {
“borderEdges”: []
}
}
]
}
],
“rowHeight”: “normal”,
“selectors”: [],
“style”: {
“alignmentX”: “left”,
“alignmentY”: “top”,
“backgroundColor”: “#F2F6FA”,
“cellSpacingX”: 8,
“cellSpacingY”: 8,
“fit”: “original”,
“gutterColor”: “#C5D3E0”
},
“version”: 1
}
],
“layouts”: [],
“steps”: {
“staticstep_1”: {
“broadcastFacet”: true,
“groups”: [],
“label”: “staticstep”,
“numbers”: [],
“selectMode”: “singlerequired”,
“strings”: [],
“type”: “staticflex”,
“values”: [
{
“display”: “Installer Name”,
“value”: “Installer_Name__c”
},
{
“display”: “Installer Company”,
“value”: “Installer_Account__c.Name”
},
{
“display”: “Created Date(Year)”,
“value”: [
“CreatedDate_Year”,
“CreatedDate_Month”
]
},
{
“display”: “Status”,
“value”: “Status_Pre_Installation_Visit__c”
}
]
},
“Status_Pre_Installat_1”: {
“broadcastFacet”: true,
“datasets”: [
{
“id”: “0FbA00000008avdKAA”,
“label”: “Only Installation”,
“name”: “Only_Installation”,
“url”: “/services/data/v42.0/wave/datasets/0FbA00000008avdKAA”
}
],
“isGlobal”: false,
“query”: {
“measures”: [
[
“count”,
“*”
]
],
“groups”: [
“{{column(staticstep_1.selection,[\”value\”]).asObject()}}”
],
“filters”: [
[
“Record_Type__c”,
[
“Pre-Order Site Visit”
],
“in”
]
]
},
“receiveFacet”: true,
“selectMode”: “single”,
“type”: “aggregateflex”,
“useGlobal”: true,
“visualizationParameters”: {
“parameters”: {
“autoFitMode”: “keepLabels”,
“showValues”: true,
“bins”: {
“breakpoints”: {
“high”: 100,
“low”: 0
},
“bands”: {
“high”: {
“color”: “#008000”,
“label”: “”
},
“low”: {
“color”: “#B22222”,
“label”: “”
},
“medium”: {
“color”: “#ffa500”,
“label”: “”
}
}
},
“legend”: {
“showHeader”: true,
“show”: true,
“customSize”: “auto”,
“position”: “right-top”,
“inside”: false
},
“axisMode”: “multi”,
“tooltip”: {
“showBinLabel”: true,
“measures”: “”,
“showPercentage”: true,
“showDimensions”: true,
“showMeasures”: true,
“customizeTooltip”: false,
“dimensions”: “”
},
“visualizationType”: “hbar”,
“title”: {
“fontSize”: 14,
“subtitleFontSize”: 11,
“label”: “”,
“align”: “center”,
“subtitleLabel”: “”
},
“binValues”: false,
“trellis”: {
“flipLabels”: false,
“showGridLines”: true,
“size”: [
100,
100
],
“enable”: false,
“type”: “x”,
“chartsPerLine”: 4
},
“columns”: [],
“measureAxis2”: {
“sqrtScale”: false,
“showTitle”: true,
“showAxis”: true,
“title”: “”,
“customDomain”: {
“showDomain”: false
}
},
“measureAxis1”: {
“sqrtScale”: false,
“showTitle”: true,
“showAxis”: true,
“title”: “”,
“customDomain”: {
“showDomain”: false
}
},
“theme”: “wave”,
“dimensionAxis”: {
“showTitle”: true,
“customSize”: “auto”,
“showAxis”: true,
“title”: “”,
“icons”: {
“useIcons”: false,
“iconProps”: {
“fit”: “cover”,
“column”: “”,
“type”: “round”
}
}
}
},
“type”: “chart”,
“options”: {}
}
},
“CreatedDate_Year_Cre_1”: {
“broadcastFacet”: true,
“datasets”: [
{
“id”: “0FbA00000008avdKAA”,
“label”: “Only Installation”,
“name”: “Only_Installation”,
“url”: “/services/data/v42.0/wave/datasets/0FbA00000008avdKAA”
}
],
“isGlobal”: false,
“label”: “test”,
“query”: {
“measures”: [
[
“count”,
“*”
]
],
“groups”: [
[
“CreatedDate_Year”,
“CreatedDate_Month”
]
]
},
“receiveFacet”: true,
“selectMode”: “single”,
“type”: “aggregateflex”,
“useGlobal”: true,
“visualizationParameters”: {
“parameters”: {
“autoFitMode”: “keepLabels”,
“showValues”: true,
“bins”: {
“breakpoints”: {
“high”: 100,
“low”: 0
},
“bands”: {
“high”: {
“color”: “#008000”,
“label”: “”
},
“low”: {
“color”: “#B22222”,
“label”: “”
},
“medium”: {
“color”: “#ffa500”,
“label”: “”
}
}
},
“legend”: {
“showHeader”: true,
“show”: true,
“customSize”: “auto”,
“position”: “right-top”,
“inside”: false
},
“axisMode”: “multi”,
“tooltip”: {
“showBinLabel”: true,
“measures”: “”,
“showPercentage”: true,
“showDimensions”: true,
“showMeasures”: true,
“customizeTooltip”: false,
“dimensions”: “”
},
“visualizationType”: “hbar”,
“title”: {
“fontSize”: 14,
“subtitleFontSize”: 11,
“label”: “”,
“align”: “center”,
“subtitleLabel”: “”
},
“binValues”: false,
“trellis”: {
“flipLabels”: false,
“showGridLines”: true,
“size”: [
100,
100
],
“enable”: false,
“type”: “x”,
“chartsPerLine”: 4
},
“columns”: [],
“measureAxis2”: {
“sqrtScale”: false,
“showTitle”: true,
“showAxis”: true,
“title”: “”,
“customDomain”: {
“showDomain”: false
}
},
“measureAxis1”: {
“sqrtScale”: false,
“showTitle”: true,
“showAxis”: true,
“title”: “”,
“customDomain”: {
“showDomain”: false
}
},
“theme”: “wave”,
“dimensionAxis”: {
“showTitle”: true,
“customSize”: “auto”,
“showAxis”: true,
“title”: “”,
“icons”: {
“useIcons”: false,
“iconProps”: {
“fit”: “cover”,
“column”: “”,
“type”: “round”
}
}
}
},
“type”: “chart”,
“options”: {}
}
}
},
“widgetStyle”: {
“backgroundColor”: “#FFFFFF”,
“borderColor”: “#E6ECF2”,
“borderEdges”: [],
“borderRadius”: 0,
“borderWidth”: 1
},
“widgets”: {
“container_1”: {
“parameters”: {
“alignmentX”: “left”,
“alignmentY”: “top”,
“fit”: “original”
},
“type”: “container”
},
“listselector_1”: {
“parameters”: {
“compact”: false,
“exploreLink”: false,
“instant”: true,
“step”: “staticstep_1”,
“title”: “display”
},
“type”: “listselector”
},
“chart_1”: {
“parameters”: {
“autoFitMode”: “keepLabels”,
“showValues”: true,
“bins”: {
“breakpoints”: {
“high”: 100,
“low”: 0
},
“bands”: {
“high”: {
“color”: “#008000”,
“label”: “”
},
“low”: {
“color”: “#B22222”,
“label”: “”
},
“medium”: {
“color”: “#ffa500”,
“label”: “”
}
}
},
“legend”: {
“showHeader”: true,
“show”: true,
“customSize”: “auto”,
“position”: “right-top”,
“inside”: false
},
“columns”: [],
“axisMode”: “multi”,
“tooltip”: {
“showBinLabel”: true,
“measures”: “”,
“showPercentage”: true,
“showDimensions”: true,
“showMeasures”: true,
“customizeTooltip”: false,
“dimensions”: “”
},
“visualizationType”: “hbar”,
“exploreLink”: true,
“title”: {
“fontSize”: 14,
“subtitleFontSize”: 11,
“label”: “”,
“align”: “center”,
“subtitleLabel”: “”
},
“binValues”: false,
“trellis”: {
“flipLabels”: false,
“showGridLines”: true,
“size”: [
100,
100
],
“enable”: false,
“type”: “x”,
“chartsPerLine”: 4
},
“measureAxis2”: {
“sqrtScale”: false,
“showTitle”: true,
“showAxis”: true,
“title”: “”,
“customDomain”: {
“showDomain”: false
}
},
“measureAxis1”: {
“sqrtScale”: false,
“showTitle”: true,
“showAxis”: true,
“title”: “”,
“customDomain”: {
“showDomain”: false
}
},
“theme”: “wave”,
“step”: “Status_Pre_Installat_1”,
“dimensionAxis”: {
“showTitle”: true,
“customSize”: “auto”,
“showAxis”: true,
“title”: “”,
“icons”: {
“useIcons”: false,
“iconProps”: {
“fit”: “cover”,
“column”: “”,
“type”: “round”
}
}
}
},
“type”: “chart”
}
}
},
“datasets”: [
{
“id”: “0FbA00000008avdKAA”,
“label”: “Only Installation”,
“name”: “Only_Installation”,
“url”: “/services/data/v42.0/wave/datasets/0FbA00000008avdKAA”
}
]
}
I only have my phone right now. So if you have checked columnMap and initial selection/single required on your static step then you are better off asking the community since I won’t be in front of a computer any time soon.
Hi Rikki,
I have Configured an Action in dataset to open salesforce record, it works fine when my lens (value table) is not edited using SAQL . However it does not work or action is not performed when I edit my lens in SAQL editer? Is this a known Issue ? Please advise
Hi Rikke,
Thank you for looking into it and quick reply. Really appreciate. i found the resolution for my issue, changed the grouping with
“{{cell(staticstep_1.selection,0,\”value\”).asObject()}}”. i works perfectly fine now.
I’m still getting the error. Can someone please tell me what needs to be changed in the columnmap section and where it will be.
Hey Rikke,
Wondering how you would do this same date binding in a SAQL query? What would the expression statement in the binding be?
Hi Murugan,
Check this out: https://www.salesforceblogger.com/2019/01/14/einstein-analytics-demystifying-bindings-part-4/
Rikke
This really helped me when I built my first dashboard in CRM analytics using the bindings. Thank you so much Rikki!
Does this not work when you have stacked chart?
I tried adding those to the values but did not work